With the JavaScript bridge in SqueakJS, we can utilize built-in web browser behavior and other JS frameworks from Smalltalk, just as any other JS code would. I’ve used it to build Caffeine apps using A-Frame and croquet.io. Another useful framework we can integrate is WebAssembly (WASM), a stack-oriented instruction set for writing high-performance code. I have begun to identify performance-critical code in the SqueakJS virtual machine, and replace it with WASM code. The initial results are encouraging and useful.
identifying hotspots
I’m running SqueakJS in the Chrome web browser. To identify virtual machine code that consumes the most time, I profile use cases that seem slow, using Chrome’s built-in devtools. The first use case I chose was drag-selecting a large quantity of text in a workspace.

From reviewing a performance capture of this use case, we can see that rgbMulwith() is the most time-consuming inner function from the BitBLT plugin. While it doesn’t modify variables in outer scopes, it does read a plugin-global variable. Most of the work it does, however, is done by partitionedMulwithnBitsnPartitions(), a pure function returning the result of a mathematical operation on the inputs, without any other system state interaction. That makes it well-suited to WASM implementation.
While there are APIs for coordinating side effects with JavaScript, they are relatively slow. It is therefore harder to rationalize WASM implementations of individual higher-level Squeak virtual machine primitives, since they interact extensively with complex JavaScript objects like the Squeak interpreter. Eventually, we’ll represent the entire Squeak object memory inside a WASM memory, and implement the entire Squeak virtual machine with WASM functions. WASM garbage collection will assist the Squeak garbage collector, much as the JavaScript garbage collector assists the SqueakJS VM now. JavaScript interaction will be limited to the WASM implementation of the SqueakJS JS bridge.
translating from JS to WASM
Here’s the existing JS implementation of partitionedMulwithnBitsnPartitions():

With its stack-based instructions, WASM code is reminiscent of Smalltalk bytecode. Here’s some of the equivalent WASM implementation of the above function, written by hand. The WASM memory holds the maskTable from BitBitPlugin.js.

Note that WASM’s shift-left and shift-right instructions are fine as is; we don’t need to make wrapper functions for them as we did in JS.
After I modified the BitBLT plugin so that rgbMulwith() uses partitionedMUL(), drag-selecting text in the Caffeine user interface was much more responsive, and a different inner BitBLT plugin function was the most time-consuming. Even though rgbMulwith() used a small percentage of total time in the first performance capture, every saved millisecond significantly improves perceived animation smoothness. By using additional use cases (scrolling long lists, and repainting by alternating the stacking order of two windows), I identified other inner BitBLT plugin functions to optimize. The Caffeine user interface is now much more responsive than it was. This is especially useful with Worldly, the spatial IDE I’m building with Caffeine and A-Frame, where every bit of performance matters.
an alternative to writing WASM by hand
For the JS code in the Squeak virtual machine, it makes sense to write replacement WASM code by hand. Since WASM code is so similar to Smalltalk bytecode, for Smalltalk compiled methods it makes more sense to use automated decompilation to WASM. I have done this for a small proof-of-concept, using a Smalltalk compiled method for the Fibonacci algorithm.
Using the Smalltalk compiler and decompiler I wrote with my Epigram parsing framework, I was able to decompile the Smalltalk compiled method for the Fibonacci algorithm into WASM text. I then used an in-browser version of the WebAssembly Binary Toolkit from Caffeine to generate binary WASM, compile it in the current page as a function, and call the function. Comparing the execution time of finding the 29th Fibonacci number in both Smalltalk and WASM showed that WASM had 250 times the execution speed of the normal SqueakJS bytecode-to-JS translator.
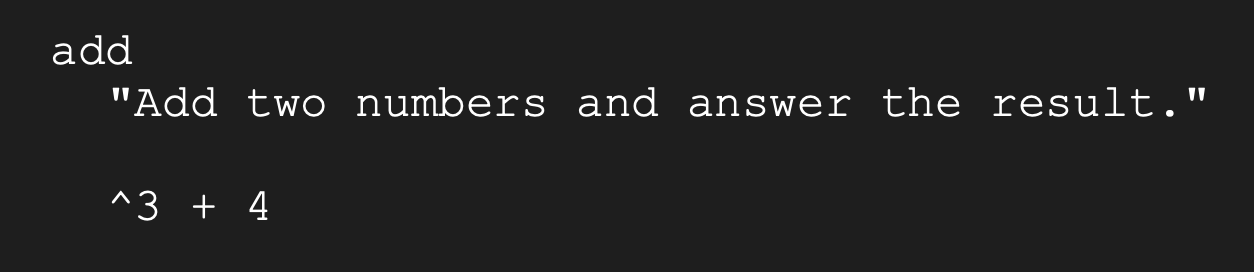
I plan to write, in Smalltalk, a version of the Squeak virtual machine simulator that stores all objects in a WASM memory. Once it can evaluate (3 + 4), I’ll translate all its Smalltalk compiled methods to WASM, and see how much faster it runs. The next step will be to get a JS bridge working, and implement interfaces to the web browser DOM for graphics and user input event handling. Ultimately, a WASM implementation of the Squeak virtual machine may be preferable to the SqueakJS virtual machine.