Archive for virtual machine

Caffeine: live web debugging with SqueakJS

Posted in Appsterdam, consulting, Context, Naiad, Smalltalk, Spoon with tags , , , , , , , , , , , , , , , , , , , , on 26 October 2016 by Craig Latta

In February 2015 I spoke about Bert Freudenberg’s SqueakJS at FOSDEM. We were all intrigued with the potential of this system to change both Smalltalk and web programming. This year I’ve had some time to pursue that potential, and the results so far are pretty exciting.

SqueakJS is a Squeak virtual machine implemented with pure JavaScript. It runs in all the web browsers, and features a bi-directional JavaScript bridge. You can invoke JavaScript functions from Smalltalk code, and pass Smalltalk blocks for JavaScript code to invoke as callbacks. This lets Smalltalk programmers take advantage of the myriad JavaScript frameworks available, as well as the extensive APIs exposed by the browsers themselves.

The most familiar built-in browser behavior is for manipulating the structure of rendered webpages (the Document Object Model, or “DOM”). Equally important is behavior for manipulating the operation of the browser itself. The Chrome Debugging Protocol is a set of JavaScript APIs for controlling every aspect of a web browser, over a WebSocket. The developer tools built into the Chrome browser are implemented using these APIs, and it’s likely that other browsers will follow.

Using the JavaScript bridge and the Chrome Debugging Protocol, I have SqueakJS controlling the web browser running it. SqueakJS can get a list of all the browser’s tabs, and control the execution of each tab, just like the built-in devtools can. Now we can use Squeak’s user interface for debugging and building webpages. We can have persistent inspectors on particular DOM elements, rather than having only the REPL console of the built-in tools. We can build DOM structures as Smalltalk object graphs, complete with scripted behavior.

I am also integrating my previous WebDAV work, so that webpages are manifested as virtual filesystems, and can be manipulated with traditional text editors and other file-oriented tools. I call this a metaphorical filesystem. It extends the livecoding ability of Smalltalk and JavaScript to the proverbial “favorite text editor”.

This all comes together in a project I call Caffeine. had fun demoing it at ESUG 2016 in Prague. Video to come…

new website for Black Page Digital

Posted in Appsterdam, consulting, Context, GLASS, music, Naiad, Seaside, Smalltalk, Spoon with tags , , , , , , , , , , , , , , , , on 21 January 2016 by Craig Latta

I wrote a new website for Black Page Digital, my consultancy in Amsterdam and San Francisco. It features a running Squeak Smalltalk that you can use for livecoding. Please check it out, pass it on, and let me know what you think!pano

new Context active filesystem layout

Posted in Appsterdam, consulting, Context, Naiad, Smalltalk, Spoon with tags , , , , , , , , , , , , , on 22 December 2014 by Craig Latta

When you start the Context app, you start a webserver that provides a “console”. Viewed through a host web browser, the console describes what Context is, and enables control of the memories it knows about. The webserver also provides an active filesystem via WebDAV. This lets you interact with the console from a host terminal or text editor, in a manner reminiscent of a Unix procfs (content is generated live-on-read). Here’s a typical filesystem layout, and what you can do with it:

/
   README.html

   memories
      3EAD9A45-F65F-445F-89C1-4CA0A9D5C2F8
         session
            state
            performance
         classes
            Object
               metaclass
                  (etc.)
               methods
                  at:
                  (etc.)
               slots
                  all
                     (etc.)
                  inherited
                     (etc.)
                  local
                     (etc.)
               subclasses
                  (etc.)
         processes
            the idle process
               ProcessorScheduler class>>idleProcess
                  source
                  variables
                     thisContext
                     self
                     (etc.)
               [] in ProcessorScheduler class>>resume
               (etc.)
            (etc.)
         workspaces
            hello world
               source
               result
                  7

The README.html file is what the console displays initially. It has a directory sibling memories, containing a subdirectory for each memory the console knows about. Each memory is named by its UUID. In the session directory, there are files which give information about a memory. The state file looks like this:

# This memory is running. You can send it one of the following
# commands: snapshot, suspend, or stop. To do so, write this file with
# the desired command as the first word after this comment. Subsequent
# comments give other information about this memory, like host
# resource usage and virtual machine plugins loaded.

(type command here)

# host resource usage
#
# bytes used:        437,598
# bytes available: 1,328,467

# virtual machine plugins loaded
#
# FlowPlugin

In this way, a file in the active filesystem provides access to a read-eval-print loop (REPL). The user gives input to the console by writing the file; the console gives feedback to the user (including documentation) by generating appropriate content when the file is read.

The performance file looks like this:

# instructions per second: 382,184,269
# messages per second:      12,355,810

This gives general profiling information about the virtual machine.

The subdirectories of the classes directory correspond to the memory’s classes. Each one has subdirectories for its methods, subclasses, and metaclass. The methods directory has a file for each method of the class. This provides the ability to browse and change source code in the memory from a host text editor.

The processes directory has a subdirectory for each running process in the memory. Each process directory has a subdirectory for each context of that process. Each context directory has a REPL file for the source code of the context’s method, and a subdirectory for the context’s variables (including the context itself), each of which is an inspector in the form of a REPL file. In this way, much of the functionality of the traditional Smalltalk debugger is accessible from a host text editor.

Finally, the workspaces directory has subdirectories for multiple “workspaces”, where one may evaluate expressions and interact with their result objects. Each workspace has a source file, another REPL file which contains instructions, the expression to evaluate, and, on the next read after write, the textual form of the result. In addition, in a result directory, is a file named for the textual form of the result, containing a REPL inspector for that result object.

These tools are useful both for newcomers to live object systems who are more comfortable with a text editor than the Smalltalk GUI, and for those accessing systems running in the cloud, for which traditional GUI access might be awkward or prohibitive.

Smalltalk Reflections episode three is up

Posted in Appsterdam, consulting, Context, music, Smalltalk, Spoon with tags , , , , , , , , , , , , , , on 16 December 2014 by Craig Latta

Check it out!

Context release 4 alpha 1

Posted in Appsterdam, consulting, Context, Naiad, Smalltalk, Spoon with tags , , , , , , on 9 December 2014 by Craig Latta

Context 4 alpha 1 is released. This one fixes loading errors in the welcome page, supports remote debugging and process browsing, and makes Naiad and remote messaging support available as Monticello packages. Thanks in advance for reporting bugs!

a most useful virtual machine debugging aid: simulated objects

Posted in Appsterdam, consulting, Context, Smalltalk, Spoon with tags , , , , , , on 2 December 2014 by Craig Latta

Squeak’s virtual machine simulator is extremely useful for debugging. You can use it to inspect and change objects “while time is stopped”, between the execution of individual virtual machine instructions. Traditionally, though, it takes an address-based view of objects. There are several useful utility methods which, given an object address, will print useful information to the Transcript. Wouldn’t it be nicer, though, if you could use normal inspectors to look through the fields of the objects in a simulated virtual machine’s object memory?

I created simulated objects for this purpose. They are instances of a SimulatedObject class; each one has an interpreter and an address. They can print useful information about themselves, like the interpreter can, but they can also modify themselves and interact with each other, changing the interpreter’s object memory appropriately. Are you wondering about the instructions of a compiled method? Would you like to make a few choice modifications to those instructions? A simulated object for that method’s address will help you.

Simulated objects play nicely with Squeak’s object inspectors, and, more importantly, with its object explorers. You feel like you’re inspecting normal objects, except that you can’t send normal messages to them. Or can you? I’m pondering this. It might be useful, for example, to terminate a process in a simulated interpreter’s object memory, without having to do it in another process. Time is stopped, but perhaps you could queue up messages to send when it starts again, through a collaboration between simulated objects and a coordinating object in the memory they describe.

I’ve been using simulated objects recently to chase references with the absolute assurance that I won’t be creating new ones. They’re very useful for debugging virtual machine primitives. Sometimes, when I’m debugging a headless system with a broken remote messaging system, it’s the only user interface I have for inspecting things. And it’s sure a lot nicer than inspecting things in a C debugger.

What will you do with them?

A Spoonful of Raspberry Pi

Posted in consulting, Naiad, Smalltalk, Spoon with tags , , , , , , , , , on 3 January 2014 by Craig Latta

Image

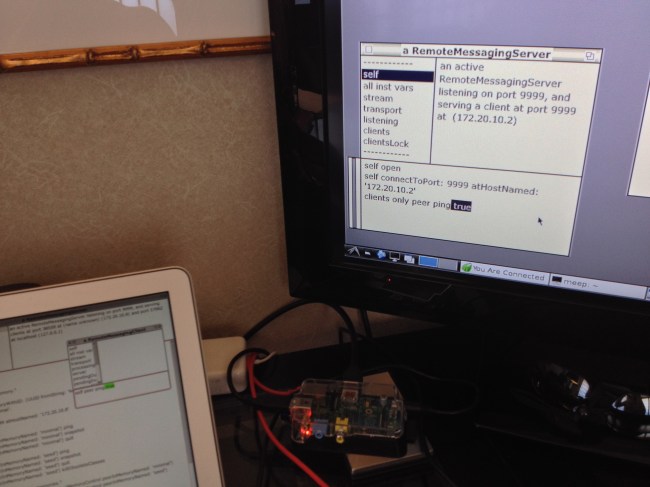
Spoon is up on the Raspberry Pi and exchanging remote messages with Spoon on my laptop. Morphic works, but it’s pretty slow, so I’ll be sticking with MVC for now (the Raspberry Pi is a 700MHz machine… I’m looking forward to Tim’s profiling work!). I’m writing a talk for FOSDEM in February called “A Spoonful of Raspberry Pi”. What should the Pi do? I’m eager to hear your suggestions!
Image

Another VM debugging trick: halting

Posted in consulting, Smalltalk, Spoon with tags , , , , on 31 December 2013 by Craig Latta

Just another little VM debugging trick I use… In one of my VM plugins I include a little C function called “breakHere”, which Smalltalk can call as a primitive. I put a breakpoint on it in the C debugger, and then have a convenient way to break in the C debugger from Smalltalk.

VM debugging trick: browsing object memory snapshots made from the C debugger in the simulator

Posted in Smalltalk, Spoon with tags , , , , , , on 17 December 2013 by Craig Latta

Recently I made use of a virtual machine debugging trick that I don’t think I’ve written about here. The virtual machine simulator is a great way to browse around the state of object memory at the point of a VM crash, but it’s relatively slow (I measured it at about 3,000 instructions per second in my sonification work). The time it takes to get to that point might be prohibitively long.

Instead, you can run to that point in the C debugger (I use lldb on Mac OS), and make a snapshot by invoking primitiveSnapshot() manually. Then, open a simulator on that snapshot and browse the objects to your heart’s content. Depending on the error, you might even be able to modify the objects such that the active process may proceed, and you can snapshot a repaired object memory from the simulator.

Image

virtual machine sonification

Posted in Smalltalk, Spoon with tags , , , , , , , on 9 December 2013 by Craig Latta

A while back I instrumented the Smalltalk virtual machine to generate visualizations of object memories. Now I’m designing instrumentations for sonification, so that the virtual machine will generate sound as it runs. This could be especially interesting for insights into the virtual machine’s operation, since I think it will run usefully in real time. It might be a useful profiling tool, for example. If you have any ideas for how to map messages and executed instructions to sound, please let me know!

%d bloggers like this: